
To be continued ...

Projects - Data Analysis
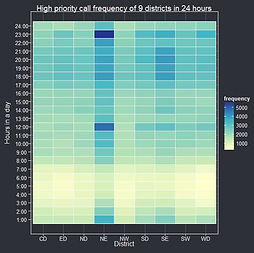
Objective: Give suggestions to Baltimore Police on improving public safety.
• Exploring the 911 call service data, seeking external data and merging datasets
• Building SARIMA time series model using R
• Visualizing the data using Leaflet, ggmap, R Shiny, and ggplot2
• Applying machine learning tool to rank the importance of democratic features on the priority of 911 calls
Time Series Model we built:
SARIMA(0, 1, 2)24 x (3, 0, 1) to predict the frequency of 911 call
ARIMA(0, 1, 4) to predict the frequency of 911 emergency call
Borrowing the idea of feature filtering from machine learning, we get a rough rank of how largely a factor influences the priority of 911 calls in this district:
1. Percentage of Hispanic 5. Percentage of Native Americans
2. Percentage of White 6. Average household size
3. Month of the year 7. Percentage of people between 44 < Age < 64
4. Percentage of Asians
Here are some data visualizations.


I'm a paragraph. Click here to add your own text and edit me. It's easy.
Projects - Machine Learning
Kaggle - KKBox's Music Recommendation Challenge
The challenge is to build a better music recommendation system.
KKbox is Asia’s leading music streaming service, holding the world’s most comprehensive Asia-Pop music library with over 30 million tracks. They currently use a collaborative filtering based algorithm with matrix factorization and word embedding in their recommendation system but they hope to find a new algorithm that is more efficient at recommending music.

Model: LightGBM

Idea:
With a combination of current algorithms, including collaborative filtering, content-based, word embedding, deep learning, and thumbs up ranking, it would probably work better. And the way to combine them is another big issue. There are ideas that we could borrow from Netflix, YouTube as well. And beyond all these methods, extracting information from the music itself, including the melodies and lyrics would probably be a direction to explore, especially when dealing with a new or unpopular song, which does not come with large historical data.
Result:
The accuracy we got was 0.68324, which ranked the top 20%.

Other Projects
> The Study of State College Temperature Over Years
Steps:
- Query data from NOAA website, which is the record of daily temperature in State College area collected in five stations from Jan. 2002 to Jan. 2017
- Clean and organize the daily temperature into monthly temperature in R
- Visualize the result and study the change of temperature over years in this area
Gains:
- Real life application of R and time series
- A deeper understanding of climate change in State College area
> Analysis of Donald Trump's tweeting
Steps:
- Extract bag of words for Trump's tweets and create word vectors
- Count the frequency of each word
- Cross compare tweets that come from Android and iPhone to draw our conclusion that there is a significant difference on the tone
Gains:
- Real life application of text mining
> Simulation of Monte Carlo
Gains:
- Application of R in random numbers generation and data simulation.
> Psychology Project
Differences in Perceptions of Cross Sex Friendships between Males and Females based on Statistics
Contributions:
- Creat the survey
- Apply statistical analysis on our collected survey
- Present the result to audience
Gains:
- Apply statistical method on real life survey
QUICK ID
Phone
Website
Address